
Abstract
Marketing mix modeling (MMM) has measured media effectiveness for decades, and lately it has gotten faster: models that once ran quarterly now refresh monthly, and vendors compete on near-real-time dashboards. Yet the distance between what measurement shows and what the business can act on has barely narrowed. Speed alone was never going to close it.
The constraint is structural. It sits in the system around the model, not the model itself: the data pipeline that feeds it, the relationships between the parties who run it, and the reporting format that delivers it. This guide sets methodology aside and looks at that operating model. It argues that AI, applied with discipline, augments rather than replaces. Used well, it compresses the mechanical work at each stage and leaves more room for human judgment. The hardest changes, though, are the organizational ones. Where organizations get this right, the result is better decisions, reached sooner and on stronger evidence.
I. Why faster measurement still arrives too late
The industry's response to slow measurement has been to make it faster, and it has largely succeeded: more automated pipelines, monthly and continuous models, near-real-time dashboards.
But faster models haven't closed the gap between results and decisions, because the delay was never only in how often the model ran. It sat in everything around the model: data that takes weeks to assemble and reconcile, results that move through client, agency, and measurement partner in sequence, and findings that arrive already framed by whoever delivered them. A model that refreshes monthly still stalls if its data takes three weeks to prepare and its results take two more to circulate.
One clarification on scope. This guide sets methodology aside. Marketscience has written at length about where conventional MMM falls short, from selection bias in last-touch channels to the long-term brand effects standard models are built to miss, and we hold firm views on it. The case for rethinking how marketing is organized for the AI era has been made for the marketing function as a whole; this guide applies it to measurement specifically.
"Even a well-specified, frequently refreshed model delivers late if the system around it is slow."
That system has three weak points that get far less attention than the model itself: the data pipeline, the organizational structure, and the reporting format. They compound. A fast model fed by slow data produces fast, unreliable results. Clean data delivered into an organization that can't act together produces clean results that sit unused. All three have to move at once.
II. Data readiness in marketing mix modeling
Ask any MMM practitioner where time goes in a project cycle and the answer is consistent. Data, not modeling. A large share of every cycle gets spent chasing, reconciling, and validating spend and impression data drawn from sources that run on different timelines and in different formats.
2.1. The silo problem
A typical MMM data ecosystem involves at least 3 independent parties: the client's in-house team, the media agency that buys, and the publishers and platforms where media runs. Each keeps its own taxonomy. The same campaign carries one name in the DSP, another in the agency's trafficking sheet, and another in the client's analytics platform. Reconciling those differences is manual, relationship-dependent, and error-prone.
The data exists, in several places at once. What's missing is a shared foundation that lets all parties access, validate, and share it at speed.
2.2. A shared campaign dictionary
The fix is a shared, machine-readable campaign dictionary: one taxonomy of brand, campaign, channel, creative, flight, and audience definitions that every party writes to and reads from using identical conventions.
Naming conventions aren't new. What's new is treating the dictionary as the primary interface through which data moves between parties, ingested automatically by the modeling platform rather than translated by hand each cycle. It becomes a governance instrument, the contractual and technical basis for clean, validated data arriving on time.
AI has a narrow, useful role here. It can flag anomalies in incoming data, catch mismatches between a new campaign name and the agreed taxonomy, and keep a structured record of data-quality decisions. It can't resolve a real discrepancy. That stays a human call. But it can cut the time spent finding discrepancies from days to minutes, so people handle only the exceptions that need judgment. We've set out where generative AI helps with marketing data management, and where it doesn't, in our 2025 Generative AI guide.
2.3. The flexible budget problem
There's a second data problem no taxonomy can solve: locked media commitments. Long upfront deals, common in television and CTV, mean that even when results arrive quickly and point to an underperforming placement, the budget can't move. Fast insight without flexible execution produces accurate findings nobody can act on.
Upfront buying has real cost advantages and isn't the target here. The point is that the ratio of committed to flexible budget should track the measurement cadence a business wants. A team that wants monthly insight needs enough programmatic and short-commitment inventory to act within the same month.
III. Faster, more focused modeling
The modeling step is a smaller bottleneck than people assume, and it's the one AI is already changing. The useful distinction is between the parts of modeling that need econometric judgment and the parts that are mechanical. AI compresses the second. The first stays human.
AI-assisted coding lets a modeler write, test, and revise specifications faster. Automated diagnostics can catch convergence failures, implausible estimates, and coverage gaps before review. Scenario analysis (for instance, what happens to ROI if 15% moves from display to CTV) that once took an afternoon can run in minutes against a validated model. These are real gains, available now, and they change none of the econometrics. The modeler still sets the structure, decides how to treat anomalous periods, and reads results in business context. We look at AI's wider role in analytics in our 2024 Power of AI guide; the short version is that it makes good practitioners faster while leaving the judgment with them.
Some tools now market themselves as "causal AI", implying the algorithm itself resolves what used to take econometric judgment. It doesn't. These tools automate the same underlying mathematics, so the identification, endogeneity, and multicollinearity problems don't disappear; they get handled by assumptions the analyst may never see or check.
"Removing the analyst doesn't remove the problems, it just hides where they were decided."
The change that matters most is in how modeling gets commissioned.
Today the model is a fixed product: the same metrics, channels, and granularity on the same schedule, whatever this quarter's pressing question happens to be. A more useful approach agrees the primary business question first, as a shared decision across client, agency, and measurement partner, then builds the model to answer it alongside the standard decomposition. Did the new creative shift base sales? Has CTV's incremental return improved since the ad reformat? Is display adding to paid search, or cannibalizing it?
This is a workflow and collaboration change before it's a methodological one, which is why it sits with the operating-model argument rather than apart from it. Sharper questions do call for more granular data and channel-specific structures, and the published literature on hierarchical and Bayesian MMM shows that higher-frequency, more granular modeling is feasible. The methodological detail is involved, and we'll treat it properly in a separate piece.
Across several of our large-scale engagements, granular MMM built on daily data and refreshed monthly resolves down to channel, partner, daypart, and format, and the cycle is used to answer the specific question that matters rather than to rerun a fixed output.
Doing it well takes care. Higher-frequency models carry real statistical risk: shorter windows give less variation to identify effects from, more sensitivity to short-run noise, and less stable estimates when data is thin. The answer is to be explicit about uncertainty. A monthly model should report confidence intervals, flag low-quality periods, and separate robust findings from directional ones. A result delivered with honest uncertainty is more useful than a single quarterly number presented as if it were exact.
IV. Reporting built for continuous decisions
The standard output of MMM is a deck presented to a room once a quarter. That format suited a world where results were an event, a moment of clarity after a long wait. For continuous decisions it falls short.
4.1. Tiered access
Different people need different things from the same results. A CMO needs to know whether the portfolio is returning above the cost of capital and which channels drive or drag it. A media planner needs publisher-level contribution to know where to move budget next month. A CFO needs returns set against financial hurdle rates. A brand manager needs the link between media and base-sales trend.
A single quarterly document tries to serve all of them and serves none of them well. The alternative is tiered access: the same underlying data, surfaced at the level each user needs, in a dashboard rather than a static file. AI can draft the plain-language summary for each level, which the analyst then checks and sets in context.
In a large telecom engagement, this shift meant moving the monthly delivery from a 50-plus slide deck to a shared template of analytical views that reaches the media teams as soon as the output is ready, with only the most decision-relevant findings elevated into a short executive readout.
The design principle that matters most is simultaneity. The CMO and the media planner should see results at the same time, not in sequence. The common practice of results moving first to the measurement partner, then the client, then the agency, with each party framing before passing on, creates information asymmetry that breeds mistrust and slows action. Simultaneous access is a governance principle in its own right.
4.2. Convergent measurement
MMM doesn't run in isolation. Most organizations also have brand tracking, campaign-level attribution, digital analytics, and various forms of testing. These streams usually sit in separate systems, get reviewed by different teams, and rarely get triangulated. Each party then tends to cite whichever source most supports its position.
A mature version of this system brings the streams into one environment, with clear documentation of what each measures, what its limits are, and how to handle apparent conflicts between them. This doesn't mean collapsing everything into a single number, which would be indefensible. It means making all the relevant evidence visible to everyone at once, so decisions get made with full sight of what's known and what's uncertain.
4.3. A caution on dashboards
Moving from decks to dashboards carries its own risk. Studies of data literacy in marketing consistently show that even experienced people misread confidence intervals, confuse correlation with contribution, and anchor on the first number they see. A dashboard that drops raw decomposition in front of a planner with no interpretation can produce worse decisions than a curated deck did.
The response is to design for it: plain-language annotations, clear flags on low-confidence findings, and explicit guidance on what each metric should and shouldn't decide. The analyst's role moves from building decks to interpreting results and guarding against their misuse, a more skilled job, and one that routine AI drafting makes more achievable.
V. The harder problem: relationships and incentives
The deepest change is organizational, and the hardest to make. Data pipelines can be rebuilt and dashboards deployed in months. The working relationships between client, agency, publisher, and measurement partner have held the same shape for decades.
5.1. Why incentives pull apart
In the current structure, the parties enter a results discussion with different objectives. The agency has a commercial interest in defending or growing spend, so findings that point to moving budget away from fee-earning channels are unwelcome. The in-house team has reason to validate decisions already made. The measurement partner is not exempt from this either: any firm whose value rests on its findings faces a pull toward presenting them as more conclusive than the evidence warrants. Naming that pull is the first step to designing it out.
This is structural rather than personal, and better data and faster models don't remove it; they surface the misalignment sooner.
Our position is to argue for the structure that removes the temptation rather than to pretend it isn't there. That means a transparent model where our own results are open to challenge by the other parties, on the same data, at the same time. This is consistent with how we already work: our methodology is published in peer-reviewed journals, open to scrutiny by the field. A measurement partner willing to put its methods to that test should welcome the same scrutiny of its results.
5.2. The collaborative model
The alternative is a structure where every party works toward the same goal: finding the most accurate picture of media effectiveness and acting on it to improve business outcomes. This doesn't mean removing the agency relationship or commercial terms. It means changing the information architecture so no single party controls the flow of results.
In practice: validated data flows from all sources to a shared platform that client, agency, and measurement team see at once. Results are released to everyone together, rather than filtered through one party and then the next. Scenarios get built in a shared environment with assumptions visible, instead of in separate rooms with each side arriving with its own numbers.
It has a working precedent in how audit and compliance functions operate in financial services: independent measurement, shared access to results, and clear rules on who can act on what. Marketing measurement hasn't adopted that standard, and there's no structural reason it can't.
Some advertisers are responding by bringing measurement in-house. That is one response to the structural problem described here. It changes who sits in the room, but the underlying need is the same: even in-house, data still arrives in different formats from agencies and platforms, the pull to validate decisions already made remains, and results still have to reach every stakeholder at once under clear governance. In-housing relocates the measurement function; it does not dissolve the operating-model problem. Whether to build in-house or partner externally is a separate question, which we take up elsewhere.
5.3. Where AI fits
AI's role in this structure is bounded. It supports the shared platform, structuring incoming data, flagging quality issues, drafting summaries, but it doesn't decide. Choices about budget, strategy, and reallocation stay with people. What AI changes is that those people work from the same evidence at the same time, instead of from filtered versions in sequence.
For the analyst, the work moves from managing data and assembling decks to setting hypotheses, interpreting findings, and communicating uncertainty well. That's a more skilled role, and one worth investing in.
Conclusion
The purpose of marketing mix modeling holds: an evidence base for media investment decisions, as valid now as when the discipline emerged. What has fallen behind is the system around it, the data pipelines, the relationships, and the reporting formats that decide how quickly and how reliably that evidence reaches the people who need it.
Applied with discipline, AI can compress the inefficiency at each stage. Data reconciliation gets faster and more reliable. Modeling becomes more responsive to the question that matters this month. Results reach every stakeholder at once, at the level each needs. The time that frees up goes back into the parts measurement can't automate: better hypotheses, interpretation with business context, and decisions that reflect what the model says and what the business knows.
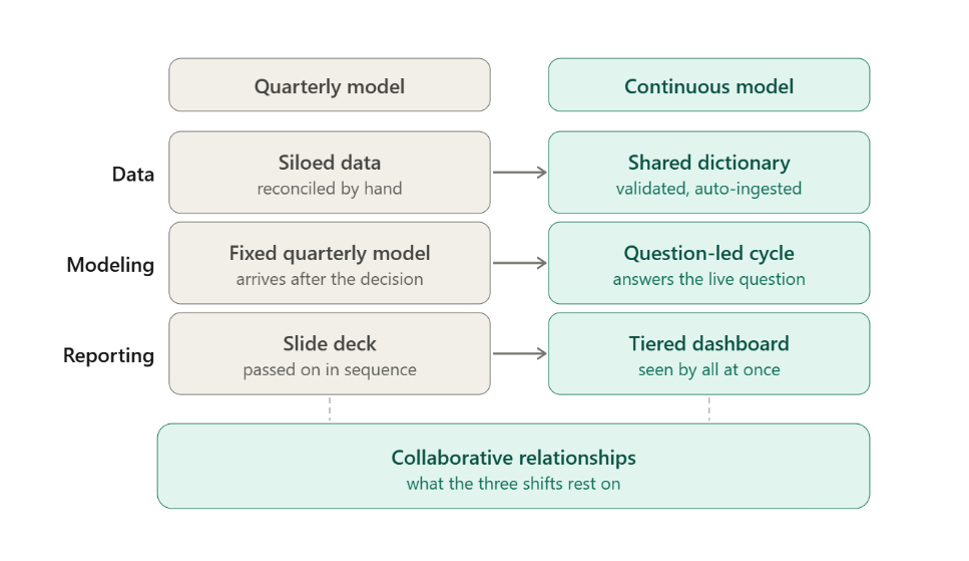
Three conditions have to move together. A shared data foundation, built on a common dictionary, simultaneous access, and clear governance, is the prerequisite for everything else. Faster modeling only helps if results reach decision-makers in time to use them. And dynamic reporting only helps if the relationships between parties are collaborative enough to act on shared evidence.
The firms that make this change get more than faster MMM. They get better decisions sooner, and that advantage compounds.
Applying These Ideas In Practice
As marketing speeds up, the limits on measurement are as much organizational as technical. Marketscience helps organizations rebuild that system, connecting data, modeling, and reporting so results reach decisions while they are still live.
Contact us to get started building a faster, more collaborative measurement operating model.

References
Cain, P.M. (2021). Modelling short- and long-term marketing effects in the consumer purchase journey. International Journal of Research in Marketing.
Attribution and the Marketing Mix Model. Marketscience, ICOM Journal.
Measuring and Integrating Brand in MMM to Drive Long-Term Value. Marketscience, Marketer's Guide to Measurement (2026).
Streamlining Marketing Data Management with Generative AI. Marketscience, Marketer's Guide to Measurement (2025).
Harnessing the Power of AI in Marketing Analytics. Marketscience, Marketer's Guide to Measurement (2024).
Taite, M., Winsor, J. and Fernandez, W. (2026). Redesigning Your Marketing Organization for the Agentic Age. Harvard Business Review.
Jin, Y., Wang, Y., Sun, L., Chan, D. and Koehler, J. (2017). Bayesian Methods for Media Mix Modeling with Carryover and Shape Effects. Google Research.
Chartered Institute of Internal Auditors (2020). The Three Lines Model.